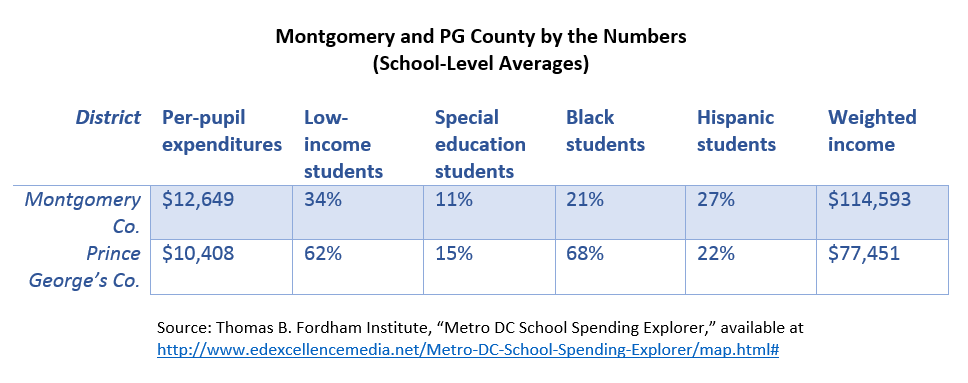
The tool provides education spending and other important demographic data for each school in the D.C. metro area. This is the first time that holistic school-level finance data has been compiled for local schools, allowing researchers, advocates, and parents to compare school spending across districts and between schools to understand whether resources are truly directed to those students who need them the most.
Because Montgomery County is a property-rich district, you might think that it simply has more revenue to spend on education. But schools aren’t only funded locally. States and the federal government layer additional money on top of district funding to help ensure all students—regardless of zip code—have a fair chance at a good education. Fordham’s tool combines these revenue sources so we can see that even nearby districts in the same state have significant variation in school spending that does not reflect student need.
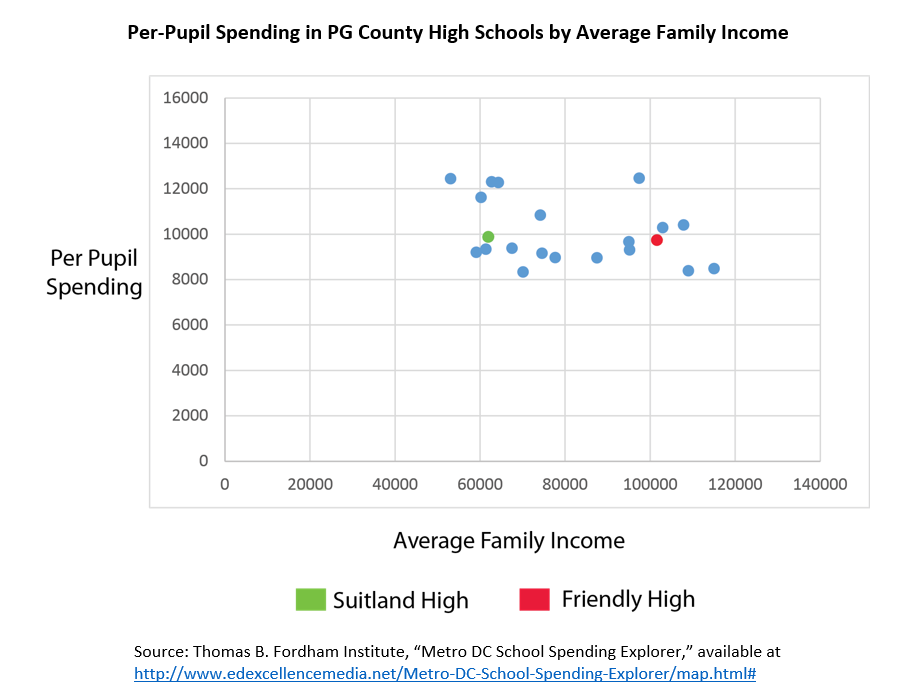
Let’s look more closely at PG County. The following graph maps the per-pupil spending in each of the high schools by the average weighted family income of the students.
State and district school funding systems must be restructured to ensure that high-need students have additional resources. In some instances, districts can adopt a weighted-student funding formula to allocate money to schools based on the actual makeup of their student body. For example, the more low-income students a school has, the more money it gets to help provided the targeted supports those students need. Without significant resources allocated where need is greatest, schools and districts will continue struggle to provide all students with high-quality teachers, extracurricular activities, and the technology that are the hallmarks of a world-class education.
Max Marchitello, guest blogger, is a policy analyst at the Center for American Progress. Reach him via email.


 RSS Feed